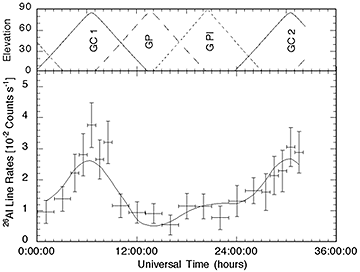
Figure 1 (above): Evolution of the measured 1809-keV line rates during the October, 25
1995 GRIS flight. The elevation angles of the different targets are shown
at the top (GC 1: G. Center 1st transit; GP: south G. pole; GPl: G. plane
at l=240 deg and ; GC 2: G. Center 2nd transit). Using a model derived from the
Galactic gamma-ray distribution (>70 MeV) measured by COS-B (solid line),
we obtained a flux of (4.8+-0.7) x 10-4 photons s-1 cm-2 rad-1 (6.8 sigma level).
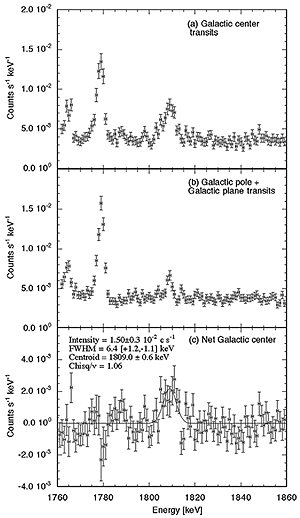
Figure 2 (right): Gamma-ray count rate spectrum near 1809 keV. (a) and (b) are the
accumulations at both Galactic Center transits and at the Galactic pole and
Galactic plane transits . These spectra show background line features at
1764 keV from the decay chain of 238U, 1779 keV from the de-excitation of
28Si, and 1809 keV from the deexcitation of 26Mg. The net Galactic
gamma-ray spectrum , derived by subtracting spectrum (b) from spectrum (a),
is displayed in (c) . It shows line emission at only 1809 keV produced in
the decay of interstellar 26Al. The solid curve is the best fit of the data
to a Gaussian line shape. Assuming an instrument energy resolution of 3.4
keV, the intrinsic width of the astrophysical line is 5.4 (+1.4,-1.3) keV
FWHM, which is more than three times the values expected from previous
theories. |

|