This website is kept for archival purposes only and is no longer updated.
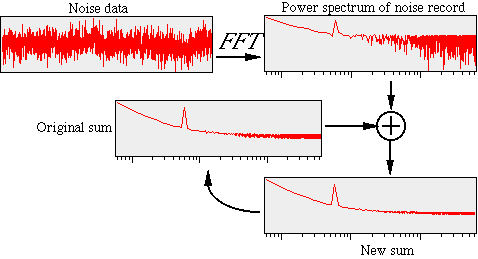
Template GenerationIn order to calculate pulseheights by optimal filtering, we need a filter template. As described in the discussion of pulseheight analysis, the template consists of the average pulse divided by the noise spectrum. Therefore we need an average pulse shape and the noise spectrum. Noise spectrumCollecting the noise spectrum is relatively easy. First a noise record (2048 samples with no pulses) is collected and transformed to the frequency domain by a Fast Fourier Transform (FFT). Each element is then squared to get the power spectrum, which is added, element by element, to a running sum of the spectrum. The figure below shows this process. The effect of adding one noise record to the running sum has been greatly exaggerated.
It is important to get an accurate estimate of the true noise power spectrum. For this reason, we need to sum a relatively large number (100-200) of individual noise spectra. Average PulseEstimating the shape of the average pulse is a bit more involved, because there may be several different shaped pulses occuring. First, pulses of different heights will not have exactly the same shape, due to the slight nonlinearity of the detector. Second, there are occasional particle events, due to cosmic rays, which have a very different shape. To ensure that we collect only one shape of pulses, the CDP first finds the most common pulse shape, and then collects only that type of pulse. To be more specific, the pulses are first collected into bins based on both the pulseheight and risetime. (Since we are trying to create a template, there is no template to calculate the pulseheight. Therefore we use the Low-res method of calculating the pulseheight.) After collecting a large number of pulses, the CDP has a 2-dimensional histogram of the pulses in risetime/pulseheight space. It then makes a rectangular box around the highest peak in the histogram, and starts accepting only pulses which fall within that box. Once the CDP is accepting the limited range of pulses, it only needs about 50 to make a good average. Each pulse is simply added, sample by sample, to a running average pulse. When enough pulses have been collected (the number is determined by a command from the ground), the sum is scaled to just fit into 16-bit numbers and saved. Final calculationOnce the noise spectrum and average pulse have been collected, the template can be made. The average pulse is transformed into the frequency domain, divided by the noise spectrum, and transformed back into the time domain. The resulting template is then scaled to fit in 16-bit numbers and becomes the new template for Hi-res pulse height analysis. At the same time, the Mid-res template is made in the same way from the noise spectrum and a fraction of the average pulse. Usually this fraction is 1/4, but it can be chosen to be smaller if the pulses are short enough.
|