This website is kept for archival purposes only and is no longer updated.
Detecting X-ray pulsesThe Problem
As you can see, the secondary pulse is barely noticeable. However,
it is still a valid signal from a perfectly good X-ray, which needs
to be counted.
Furthermore, if it were not detected, the calculated pulseheight of
the 10keV pulse would be affected. Thus it is very important that the
CDP can detect secondary pulses even when they are much smaller than
the initial pulse. Use The Derivative, LukeThe pulse detection algorithm is based on using a smoothed
derivative (slope) of the data. We use
the derivative so that DC level of the data
doesn't affect the detection of pulses. The derivative is calculated by convolving
the data with a boxcar derivative function. That is, to find the derivative at
time T, we multiply several data points on each side of point T by
the corresponding point in an array that
looks like this:
The initial pulse is detected when the derivative exceeds a fixed threshold. This threshold must be set low enough so that even the smallest pulses will be detected, but high enough that the noise in the system will not cause false triggers. Notice that the single-pulse (blue) and double-hit (red)
derivative traces are nearly indistinguishable. In particular, the
derivative doesn't go above (or even near) zero when the second pulse
happens. So using the derivative hasn't directly helped to
identify double-hits. To do that we need to compare the actual
derivative to the value we would expect from a single
pulse. The Adjusted Derivative
The CDP software maintains a copy of what the single-pulse derivative shape is. Then when a pulse occurs, the expected derivative shape is scaled and subtracted from the calculated derivative to form the adjusted derivative. The adjusted derivative is then used in place of the derivative
for detection of secondary pulses. The adjusted derivative is
compared to a threshold, and a secondary pulse is
detected when it exceeds that threshold. (Actually, it's slightly
more complicated than that, but that's the basic idea.) Counting DownOnce an initial pulse has been detected, the CDP begins counting down the length of a Hi-res data record. This is the number of samples needed by the PHA algorithm to calculate the pulseheight to the highest possible resolution. If it reaches zero without detecting any secondary pulses, the event is flagged as a hi-res record and processed. If a secondary pulse does occur, the initial pulse will be processed as either a Mid-res or Low-res event, and the counter will reset to the full Hi-res length. Further secondary pulses will be treated the same way.
|

 The first job of the DSP code is to
detect pulses in the data stream. Detecting initial pulses
is easy; the hard part is finding small secondary pulses
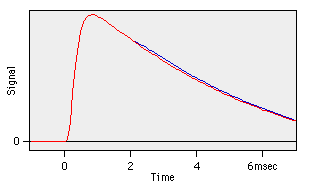
on top of large ones. Here is a 200eV secondary pulse (blue) 2 milliseconds after a 10keV initial
pulse (red).
The first job of the DSP code is to
detect pulses in the data stream. Detecting initial pulses
is easy; the hard part is finding small secondary pulses
on top of large ones. Here is a 200eV secondary pulse (blue) 2 milliseconds after a 10keV initial
pulse (red).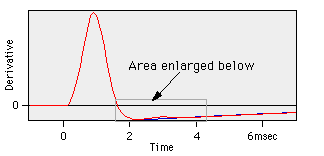 This convolution smoothes the data
as well as finding the derivative. The derivatives of the two
pulses shown above look as shown here.
This convolution smoothes the data
as well as finding the derivative. The derivatives of the two
pulses shown above look as shown here.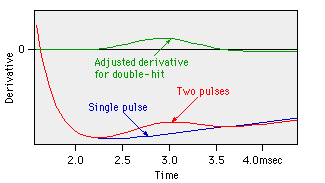 Here is an expanded view of the area indicated above. The
data containing a secondary pulse is clearly distinguishable from the
single pulse. We just need to be more sophisticated than a simple
threshold.
Here is an expanded view of the area indicated above. The
data containing a secondary pulse is clearly distinguishable from the
single pulse. We just need to be more sophisticated than a simple
threshold.

